Looking Past the Frameworks
Static Project Outcome Results
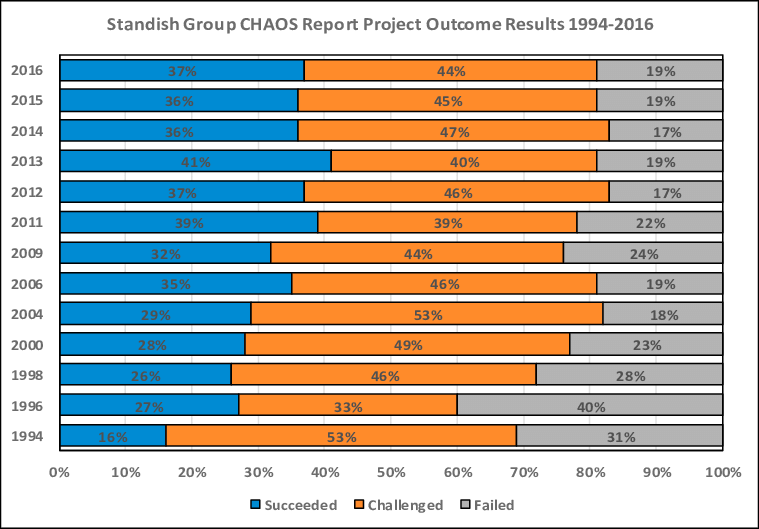
The way I read this chart, the success rate of software projects didn’t significantly improve between 2006 and 2016. It’s a 36.5±4.5% success rate over the last 20 years with a minor positive trend, and a 20.5±3.5% failure rate over the same timeframe. The success rate improves in two big jumps in 1994 and in 2004; but stays relatively stable otherwise.
But that 2006-2016 timeframe saw the introduction of a number of frameworks aimed at improving velocity or team success: Agile (2001), DevOps (2010ish), SAFe (2005), Team Topologies (2019), Spotify (2012), etc. — with the exception of Agile, none demonstrably impacted the overall success rate.
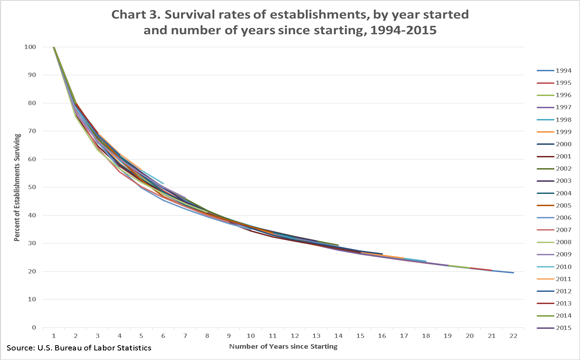
A similar pattern of stability appears with startups too. The success rate of startups has been stable since the mid-1990’s.1 And that is also in spite of the various frameworks, accelerators, incubators, and college entrepreneur programs that have risen.
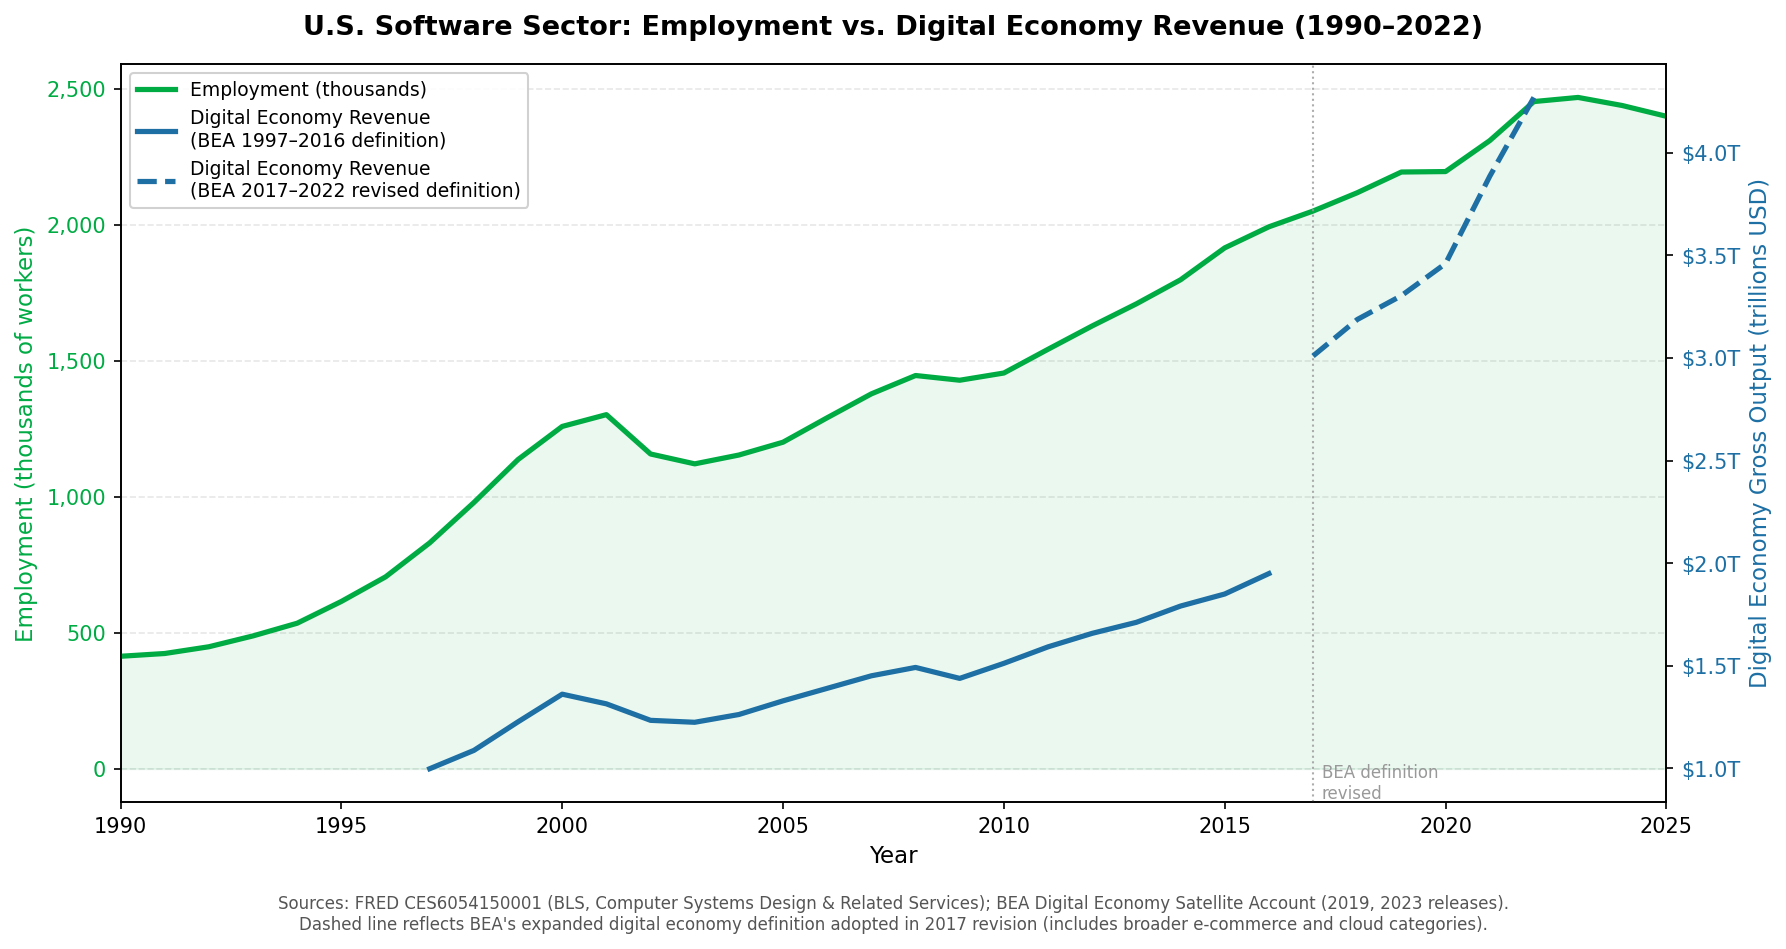
Taking a step back, ‘project’ success doesn’t necessarily translate to business success. What if we look at revenue per employee in the software industry? That looks pretty static too. At least until 2017 when the BEA changed how they reported Digital Economy revenue. The biggest non-definition related jump was in 2020, which was clearly a Covid windfall for software companies.
Software Sector Growth: Employment vs. Revenue
As an industry, our practices and products have clearly gotten better over the last 20 years. The industry has grown way more complex. The constant failure rate indicates we are more capable. The various frameworks and practices play an important part in managing and navigating that complexity.
But these graphs tell another story, too. Frameworks themselves are not moving the needle; the average is staying consistent across time. If various frameworks improve outcomes, there would be a corresponding increase in overall success rates. But we don’t see a corresponding improvement in project success rates or revenue per employee.
By definition there are teams who outperform the mean. The success of those high performers goes beyond framework adoption. The stability in success, failure, and revenue across more than 20 years shows that performance is disconnected from the prevailing trends.
-
Startup survival rates have remained stable since at least the mid-1990s across two independent lines of evidence. Scott Shane’s The Illusions of Entrepreneurship (Yale University Press, 2008) draws on BLS and Census longitudinal data covering business cohorts from roughly 1994–2007, finding that approximately 50% of new businesses fail within five years and 65% within ten — rates that held steady despite the rapid growth of entrepreneurship courses, incubators, and accelerators over the same period. BLS Business Employment Dynamics data extending through 2024 shows the same pattern: ~22% of new private-sector businesses fail in year one, ~49% by year five, with no meaningful trend improvement. Together these series document stable failure rates across 30 years (1994–2024), spanning the entire modern startup ecosystem — Y Combinator (2005), the accelerator boom (2008–2015), and the ZIRP-era funding surge (2009–2022).
- Shane, S. (2008). The Illusions of Entrepreneurship: The Costly Myths That Entrepreneurs, Investors, and Policy Makers Live By. Yale University Press.
- U.S. Bureau of Labor Statistics. “Entrepreneurship and the U.S. Economy.” Business Employment Dynamics. https://www.bls.gov/bdm/entrepreneurship/entrepreneurship.htm
-
Employment data: FRED series CES6054150001, “All Employees, Computer Systems Design and Related Services” (BLS, seasonally adjusted, January 1990–present). Revenue data: BEA Digital Economy Satellite Account — current-dollar gross output, 1997–2016 definition (April 2019 release) spliced with 2017–2022 revised definition (December 2023 release). The dashed line marks BEA’s 2017 definitional expansion, which added broader e-commerce and cloud categories and is not directly comparable to the earlier series.
- U.S. Bureau of Labor Statistics. FRED series CES6054150001. https://fred.stlouisfed.org/series/CES6054150001
- U.S. Bureau of Economic Analysis. “Defining and Measuring the Digital Economy.” https://www.bea.gov/data/special-topics/digital-economy